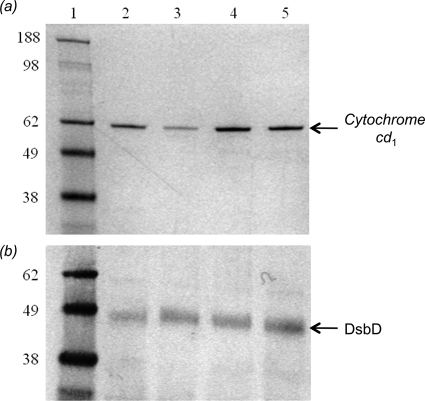
FIGURE 8.
SDS-PAGE analysis for the assessment of the activity of full-length V462A-DsbD in vivo. a, levels of cytochrome cd1 production under anaerobic growth conditions are assessed using heme staining, which detects covalently bound heme. Lane 1, molecular mass markers; lane 2, the level of cd1 production in the parental strain; lanes 3–5, the level of cd1 production in the dsbD deletion strain complemented with full-length C464A-DsbD (lane 3), wild-type DsbD (lane 4), and V462A-DsbD (lane 5) on a plasmid. b, expression levels of full-length wild-type and variant DsbDs during the anaerobic growths are assessed with a Western blot using anti-cDsbD antibody. Lane 1, molecular mass markers; lane 2, the level of full-length wild-type DsbD production in the parental strain; lanes 3–5, the levels of C464A-DsbD (lane 3), wild-type DsbD (lane 4), and V462A-DsbD (lane 5) production from a plasmid in the dsbD deletion strain.

