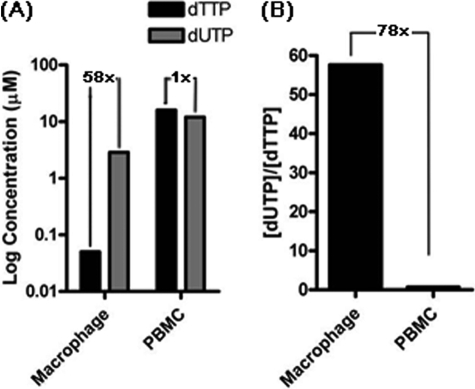
FIGURE 1.
Comparison of dUTP and TTP concentrations of human primary macrophages and activated PBMCs. A, the dUTP concentrations of macrophages and activated PBMCs, which were determined by LC-MS/MS (summarized in Table 1), are plotted with gray bars. The black bars represent TTP concentrations of human primary macrophages and activated CD4+ T cells previously determined by LC-MS/MS (9). The -fold differences between dTTP and dUTP in each cell type are shown. B, the dUTP/TTP concentration ratio difference between the two cell types calculated from the LC-MS/MS analysis data.

