FIGURE 2.
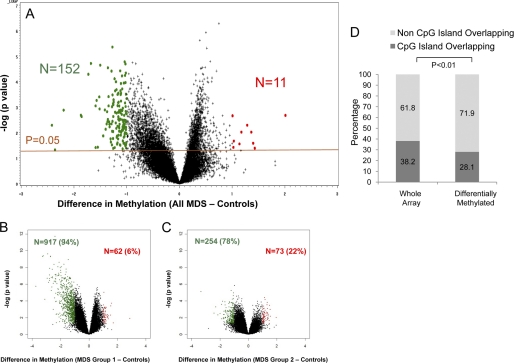
Majority of differentially methylated loci are hypermethylated in MDS leukocytes and reside outside of CpG islands. A volcano plot is shown demonstrating the difference in mean methylation between all MDS samples and controls on the x axis and the log of the p values between the means on the y axis. A two-tailed t test was used to calculate the p values. Significantly methylated loci with a log fold change in mean methylation are labeled in green, and significantly hypomethylated loci are labeled in red (A). Volcano plots for MDS subgroups 1 and 2 also reveal mostly hypermethylated loci with a variable number of hypomethylated loci. B and C, genomic position of every HpaII-amplifiable fragment on the HELP array was compared with the location of known CpG islands, and the fragments on the array were divided into two categories, those overlapping with these genomic elements and those not overlapping. To determine whether the differentially methylated genes between MDS and controls were enriched for either one of these types of elements, a proportions test was used to compare the relative proportion of the two types of HpaII fragments in the signature with the relative proportion on the array. Stacking bars are used to illustrate the finding of a significant enrichment for HpaII-amplifiable fragments not overlapping with CpG islands (D).

