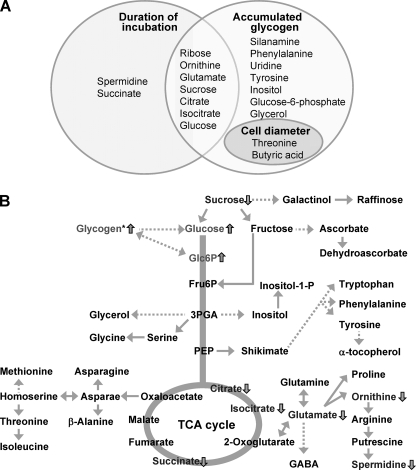
FIGURE 10.
Changes in metabolite levels in ΔaqpZ cells in comparison with the WT grown for 48 h under photomixotrophic conditions based on metabolite profiling using GC/TOF-MS. A, Venn diagram of annotated metabolites that showed significant interaction effects with duration of culture, accumulated glycogen, and cell diameter. The corresponding box plots data sets are shown in supplemental Figs. S3–S5. B, diagram depicting key steps in glycolysis, the pentose phosphate pathway, the TCA cycle, and related pathways. Increase or decrease of metabolites in the ΔaqpZ mutant compared with the wild type is shown as upward or downward arrows, respectively. The data were derived from the data set shown in supplemental Fig. S2. 3PGA, 3-phosphoglycerate; PEP, phosphoenolpyruvate; Fru6P, fructose 6-phosphate; Glc6P, glucose 6-phosphate; GABA, γ-aminobutyric acid.

