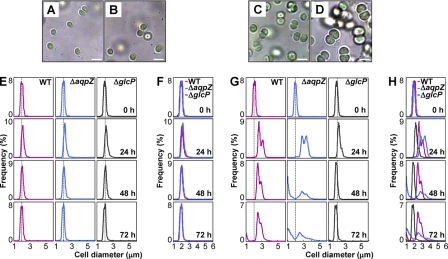
FIGURE 5.
Effects of glucose on the size distribution of Synechocystis cells. A–D, WT and ΔaqpZ cells were grown under photoautotrophic or photomixotrophic (5 mm glucose) conditions. A, WT cells; B, ΔaqpZ cells; C, WT cells with 5 mm glucose; D, ΔaqpZ cells with 5 mm glucose. Cells were photographed at 48 h. Bars, 3 μm. E–H, WT, ΔaqpZ cells and ΔglcP cells were cultured in medium without (E and F) or with 5 mm glucose (G and H), and the cell sizes were determined by a particle counter. Vertical dashed lines in E and G, 2 μm in diameter of the cells. WT, ΔaqpZ, and ΔglcP cells are indicated by red, blue, and gray lines, respectively. F and H, overlays of the distributions shown in E and G, respectively.

