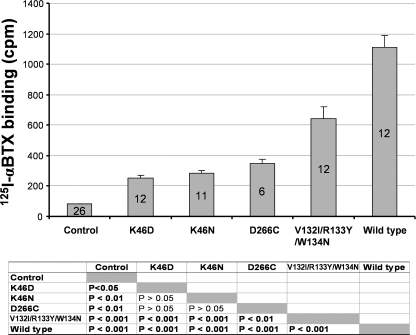
FIGURE 6.
Nonfunctional mutant receptors, used in the rescuing experiments in Figs. 3–5, exhibited 125I-α-BTX binding above the background. The bar graph represents the average 125I-α-BTX bindings in the mutant and wild type receptor-expressing single oocytes or nonexpressing controls. Number of oocytes used in the binding experiments in each group is indicated in each bar. The p values for analysis of variance post hoc multiple comparison tests are shown below the bar graph. Note that the binding in the control oocytes represents nonspecific binding, and all mutant and wild type receptor-expressing oocytes exhibited higher-than-background binding, suggesting that all these mutant receptors have some level of surface expression. Note that all the mutant-expressing oocytes had lower binding values compared with the wild type-expressing oocytes, although with a similar amount of cRNA injection. After subtracting background control value, their specific bindings are 16.5% (K46D), 19.7% (K46N), 25.9% (D266C), and 54.3% (V132I/R133Y/W134N) of the wild type binding.

