FIGURE 1.
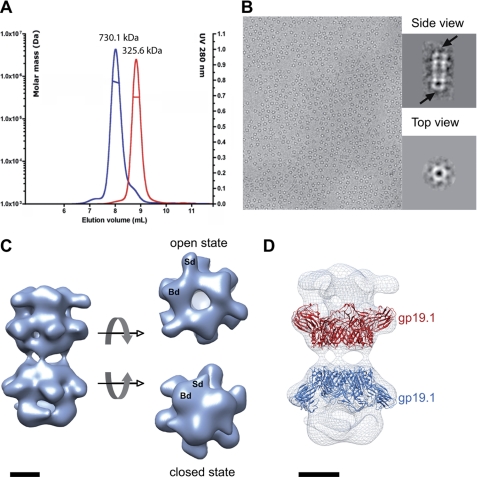
Characterization of gp19.1-gp211–552 complexes. A, SEC elution profile of gp19.1 (Dit) (red curve) and gp19.1 in the presence of gp211–552 (blue curve). The displacement of the elution volume indicates that gp211–552 interacts with gp19.1. The computed masses are indicated above each peak. B, image of frozen-hydrated gp19.1-gp211–552 complexes revealing two preferential orientations in amorphous ice. Insets display class averages corresponding to side and top views, in which arrows show structural differences observed at the extremities of gp19.1-gp211–552 particles. C, EM reconstruction of frozen-hydrated gp19.1-gp211–552 complexes at 26-Å resolution at 0.5 FSC (Fourier Shell Correlation) cut-off. Two different conformations were observed at the complex extremities, corresponding to open and closed states. The structure extremities consist of a trimer of bilobed densities named Broad (Bd) and Sharpened (Sd) densities, respectively. D, fit of the gp19.1 atomic structure in a cryo-EM map. Two hexamers of gp19.1 have been fitted independently in the cryo-EM reconstruction. Scale bars, 5 nm.

