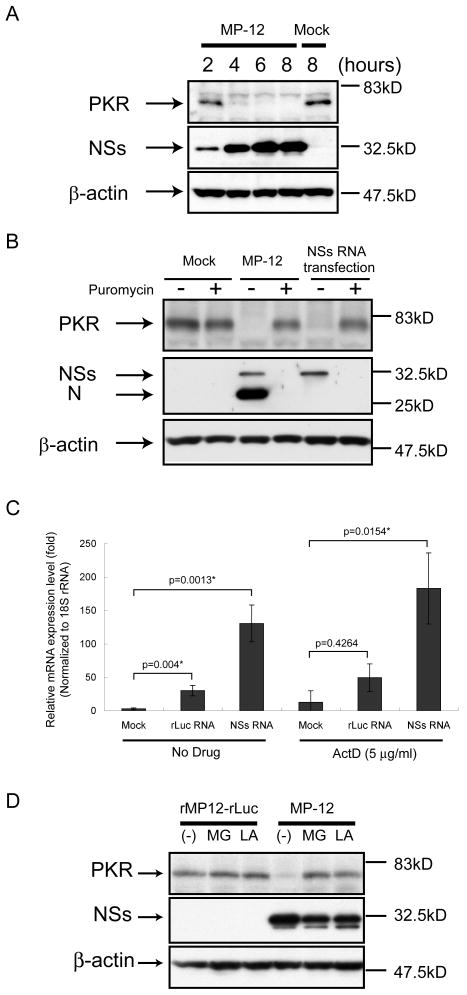
Figure 5.
Analysis of NSs-induced PKR downregulation. The Fig is adapted from Ikegami et al.[26] (A) 293 cells were mock infected (Mock) or infected with MP-12 (MP-12) at an moi of 3. Whole-cell lysates were collected at 2, 4, 6 and 8 h.p.i. Anti-PKR antibody, anti-NSs antibody and anti-β-actin antibody were used to detect PKR, NSs and β-actin, respectively. (B) 293 cells were mock infected (Mock) or infected with MP-12 at an moi of 3 or transfected with in vitro-synthesized RNA transcripts encoding NSs. Cells were then mock-treated or treated with 100μg/ml of puromycin. Cell extracts were harvested at 16 h.p.i. or 16 h post transfection, and the abundance of PKR and viral proteins were analyzed by Western blotting with anti-PKR antibody (top panel), anti-RVFV antibody (middle panel) or anti-β-actin antibody (bottom panel). (C) 293 cells were mock-transfected or transfected with in vitro-synthesized RNA transcripts encoding MP-12 NSs or rLuc. Cells were mock-treated or treated with 5 μg/ml of ActD. Total RNA was harvested at 8 h post transfection, and analyzed by real-time PCR. The relative abundance of PKR mRNA of each sample was calculated by the ΔΔCT method based on the abundance of 18S ribosomal RNA. The data shown in the graph (mean +/- standard deviation) were obtained from three independent experiments. The p value was determined by Student's t-test (*: p<0.05). (D) 293 cells were infected with rMP12-rLuc or MP-12 at an moi of 3, and, then, treated with 10 μM of MG132 (MG) or 50 μM of lactacystin (LA) or they were mock treated (-). Whole-cell lysates were collected at 8 h.p.i. and the abundance of PKR, NSs and β-actin was examined by Western blot analysis.

