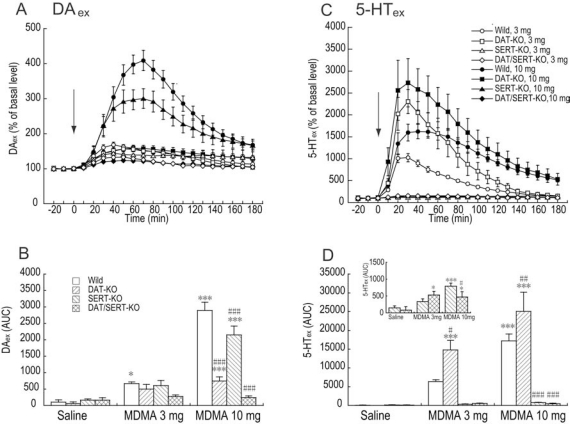
Fig. (1).
Effects of MDMA on DAex and 5-HTex in the striatum in wildtype, DAT-KO, SERT-KO, and DAT/SERT double-KO mice. (A, C) Temporal pattern of DAex and 5-HTex before and after injection with saline or MDMA (3 and 10 mg/kg, s.c.). The arrows indicate drug injection time. Each point represents the mean ± SEM of the percentage of DAex or 5-HTex baselines. (B, D) Histogram representing the mean AUC (± SEM) of DAex or 5-HTex during the 180 min period after injection with saline or MDMA (n = 4-8). *p < 0.05, ***p < 0.001, compared with saline group of the same genotype; #p < 0.05, ##p < 0.01, ###p < 0.001, compared with corresponding wildtype data in the same drug treatment (two-way ANOVA followed by Fisher’s PLSD post hoc test).

