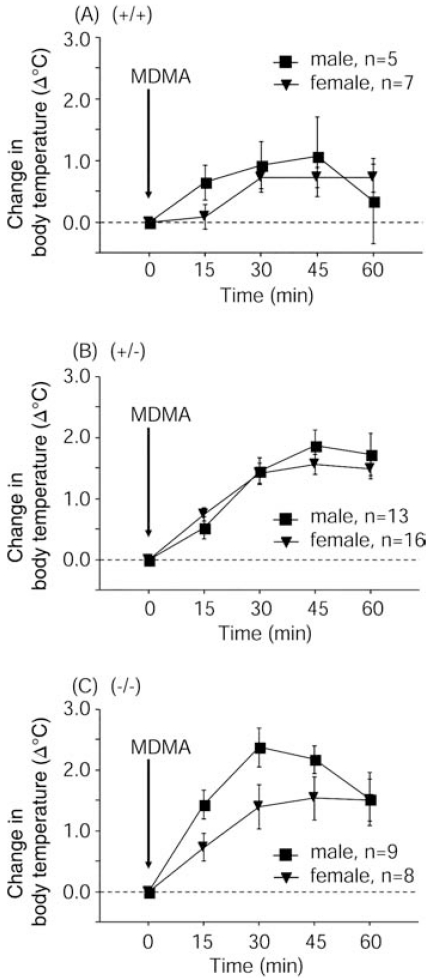
Fig. (2).
Similar MDMA-induced (30 mg/kg, i.p.) hyperthermia was observed in male and female mice within each genotype. Body temperature areas-under-the-curve were analyzed by repeated-measures ANOVA. (A) Sex, F1,10 = 0.181, p = 0.6796; Time, F4,40 = 4.741, p = 0.0032; Sex × Time interaction, F4,40 = 1.124, p = 0.3587. (B) Sex, F1,27 = 0.134, p = 0.7170; Time, F4,108 = 62.705, p < 0.0001; Sex × Time interaction, F4,108 = 1.231, p = 0.3021. (C) Sex, F1,15 = 2.350, p = 0.1461; Time, F4,60 = 26.22, p < 0.0001; Sex × Time interaction, F4,60 = 2.059, p = 0.0974.

