Figure 5.
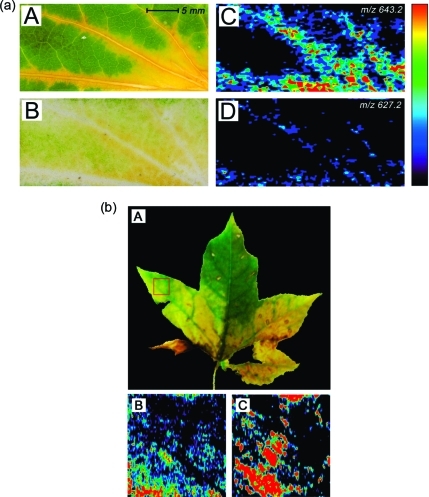
(a) Negative ion mode DESI imaging of a senescent Katsura tree leaf imprint on porous PTFE substrate. Spray solvent was 1% concentrated aqueous ammonia in methanol at a flow rate of 1.5 μL/min. Imaging parameters: 1.17 s/scan; 98 scans/horizontal row; 56 rows; pixel size was 310 × 250 μm; total acquisition time was 107 min. (A) 30.7 × 13.9 mm section of a photographic image taken from a senescent Katsura leaf. (B) 30.7 × 13.9 mm porous PTFE substrate with Katsura leaf imprint. (C, D) Ion images of the two chlorophyll catabolites7,45 in Katsura leaves at m/z 643.2 and 627.2. Both images are plotted on the same color scale, which is depicted on the right-hand side of the figure to visualize relative ion intensities from 0 (black) to 100 (red). (b) Negative ion mode DESI imaging of a senescent American sweetgum leaf imprint on porous PTFE substrate. Spray solvent was 1% concentrated aqueous ammonia in methanol at a flow rate of 1.5 μL/min. Imaging parameters: 0.72 s/scan; 119 scans/horizontal row; 50 rows; pixel size was 130 × 300 μm; total acquisition time was 71 min. (A) Photographic image taken from a senescent American sweetgum leaf. The rastered 15 × 15 mm section is highlighted in red. (B, C) Ion images of the two chlorophyll catabolites found in American sweetgum(46) at m/z 643.2 and 627.2. Both images are plotted on the same color scale, which is depicted on the right-hand side of panel a to visualize relative ion intensities from 0 (black) to 100 (red).

