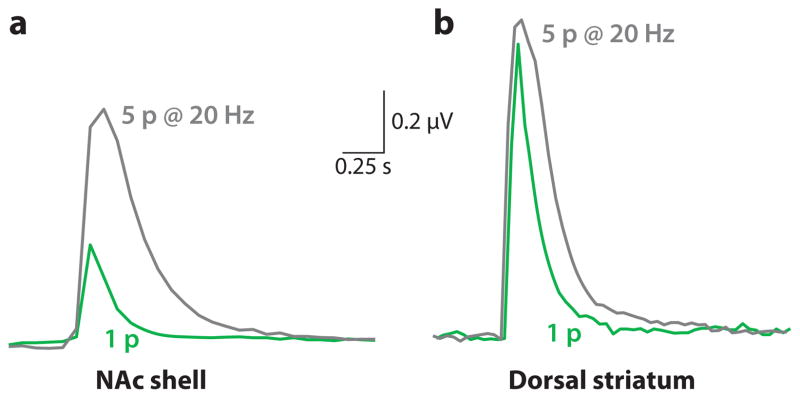
Figure 2.
Different dopamine (DA) release properties in the dorsal striatum and NAc shell. DA release was evoked by a single electrical stimulus pulse (1p) or by a stimulus train of 5 pulses delivered at 20 Hz (5p @ 20Hz) to brain slices. The traces represent DA concentration measured in brain slices by carbon-fiber voltammetry. Example measurements are shown of the DA signal evoked by 1p (gray traces) or by 5p at 20 Hz (green traces). In the NAc shell, the DA signal evoked by 1p is much smaller than that evoked by 5p (as measured by the area under the curve) curve). In the dorsal striatum, the DA signal evoked by 1p is only slightly slight smaller than that evoked by a 5p train. Adapted from data within Zhang et al (2009b).

