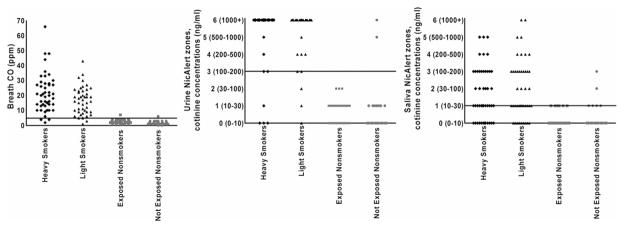
Figure 1.
Variability of breath carbon monoxide (CO), urine NicAlert® and saliva NicAlert® based on self-reported smoking status. Each dot represents an individual participant. Horizontal lines represent cut-offs discriminating smokers from non-smokers for each indicator (breath CO ≥5 parts per million (p.p.m.), urine NicAlert® ≥zone 3/100 ng/ml cotinine, saliva NicAlert® ≥zone 1/>10 ng/ml cotinine)

