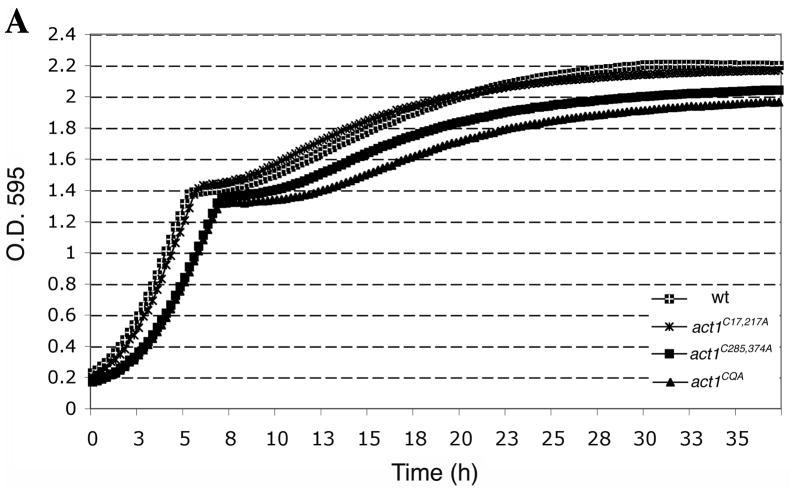
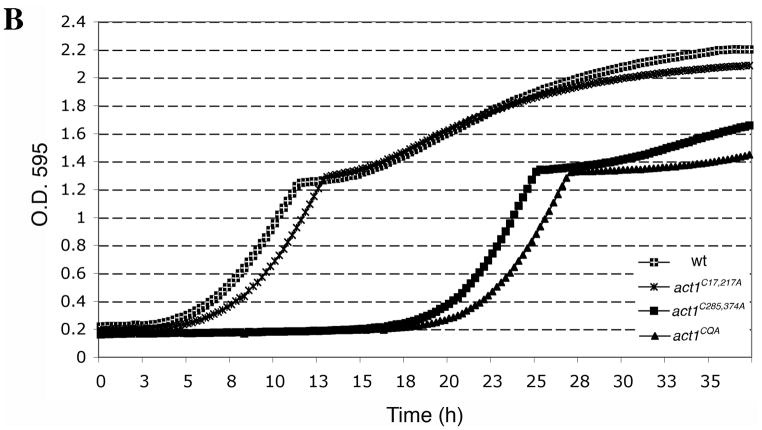
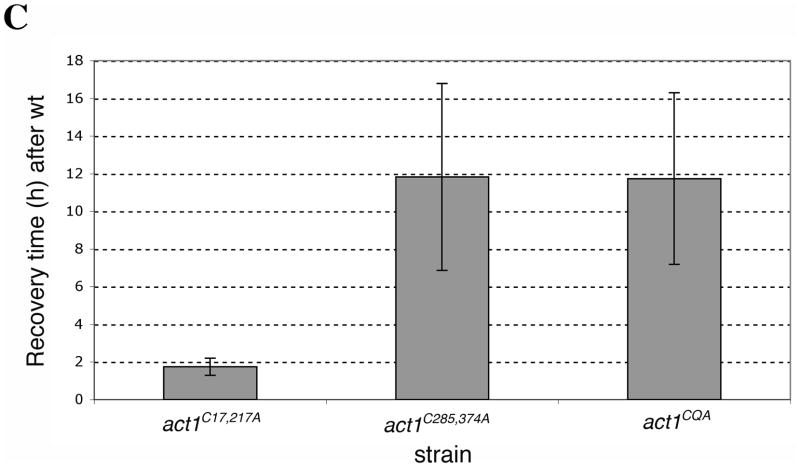
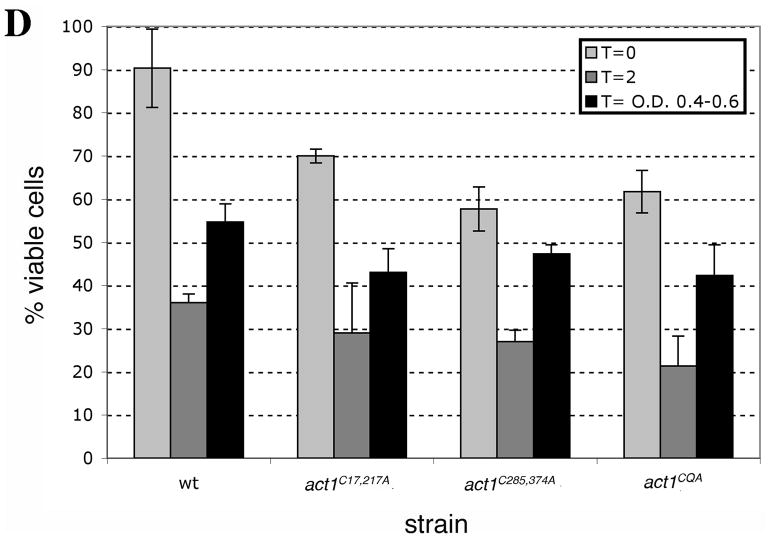
Figure 6. Actin cysteines are required for efficient recovery from oxidative stress.
Representative growth curves monitored by OD595 for wild type and mutant cells grown in (A) YPD and (B) YPD plus 2.9 mM H2O2. Untreated and treated cultures were seeded from starter cultures after an initial 3.5 h of logarithmic growth in YPD. Cultures were incubated and monitored in a TECAN Infinite F200. (C) Comparison of the recovery time for actin cysteine mutants. The recovery time was measured as the time interval from starting the culture (t=0) till the time each culture reached half of the OD595 reading at the diauxic shift. To illustrate the delay in recovery of mutants, bars in the graph show the recovery times subtracted for the recovery time observed for wild type cells. Values represent averages ± S.D. from at least three different experiments. (D) Comparison of the percent of cell viability for wild type and mutant strains before addition of 2.9 mM H2O2 (T=0, light gray), 2 h post-H2O2 addition (dark gray) and at a time point between OD 595 0.4–0.6 after recovery (black). Values are means ± S.D.


