Figure 1.
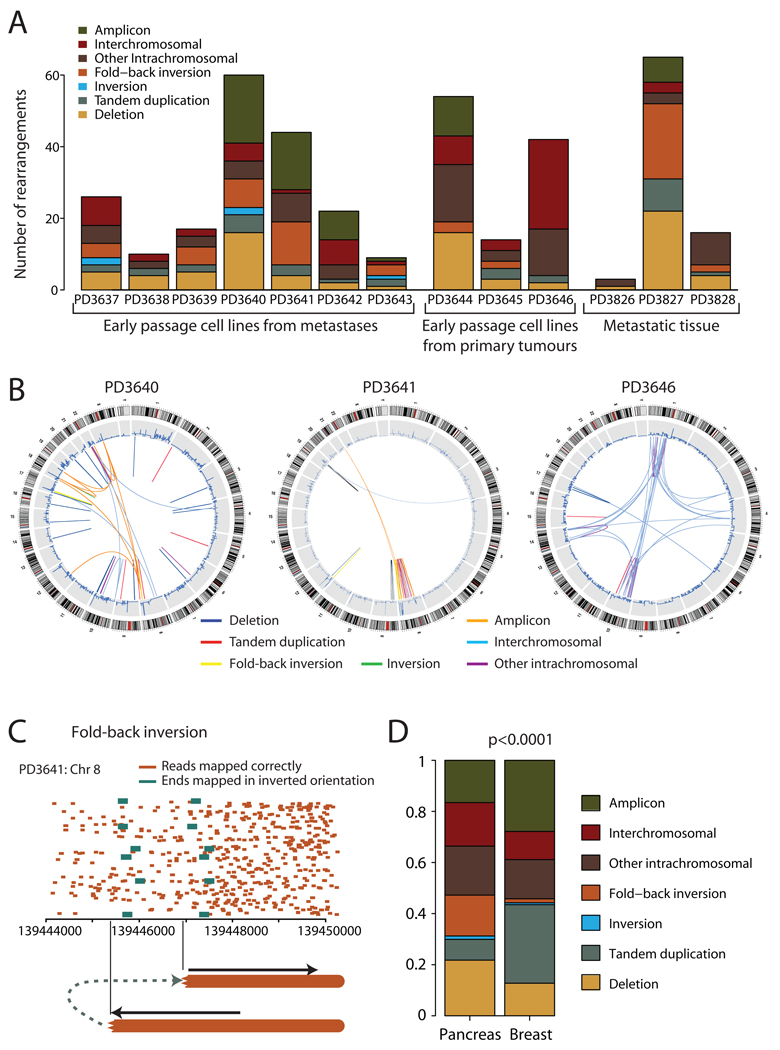
Patterns of somatically acquired genomic rearrangements in pancreatic cancer. (A) Histogram showing the distribution of the number and types of rearrangement observed in 13 patients with pancreatic cancer. (B) Circle plots showing the genomic landscape of rearrangements in three representative samples. Chromosome ideograms are shown around the outer ring with copy number plots on the inner ring. Individual rearrangements are shown as arcs joining the two genomic loci, each coloured according to the type of rearrangement. (C) Example of a so-called ‘fold-back inversion’. Correctly mapping paired reads (orange) show much greater density on the right half of the figure than the left, suggesting that the copy number is higher here. The change in copy number is demarcated by anomalously mapping paired reads (green), aligning ~2kb apart on the genome and in inverted orientation. The only genomic structure which can explain this pattern is a rearrangement in which the abnormal chromosome is ‘folded back’ on itself leading to duplicated genomic segments in head-to-head (inverted) orientation. (D) The distribution of types of rearrangement was significantly different between breast cancer and pancreatic cancer (p<0.0001).

