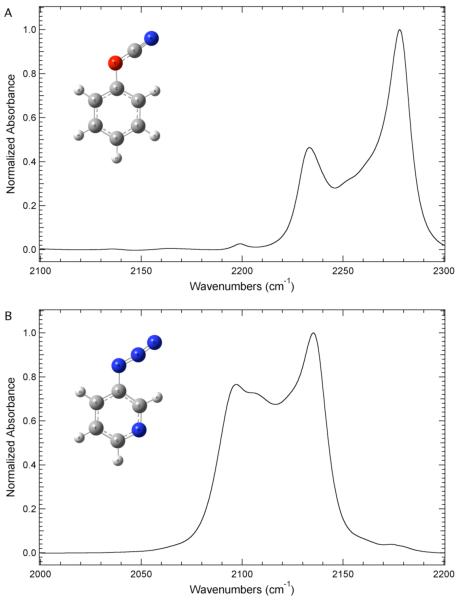
Figure 1.
A. FTIR absorbance spectra of phenyl cyanate (PhOCN) in the cyanate asymmetric stretching region. B. FTIR absorbance spectrum of 3-azidopyridine (PyrNNN) in the azide asymmetric stretching region. Both molecules were dissolved in tetrahydrofuran (THF) and the spectra were recorded at 298 K. The maximum absorbance of each spectrum has been normalized to unity. The DFT optimized structure of each molecule at the B3PW91/6-31++G(d,p) level is shown in the insets.

