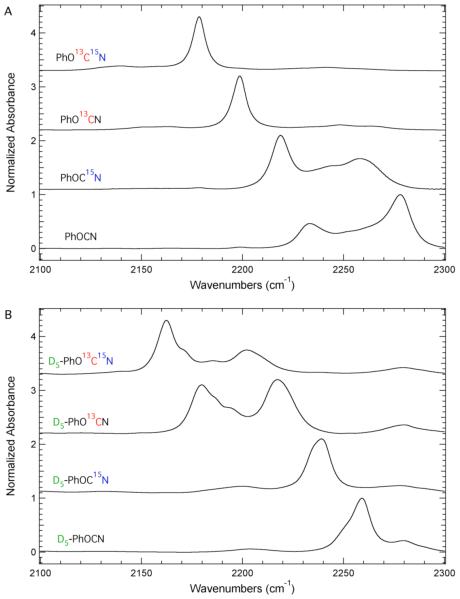
Figure 2.
FTIR absorbance spectra of isotopomers of phenyl cyanate in the cyanate asymmetric stretching region recorded at 298 K in THF. The maximum absorbance of each spectrum has been normalized to unity and the spectra have been offset for comparison. Panel A includes the IR spectra of PhOCN, PhOC15N, PhO13CN, and PhO13C15N. The IR spectra of D5-PhOCN, D5-PhOC15N, D5-PhO13CN, and D5-PhO13C15N are shown in Panel B.

