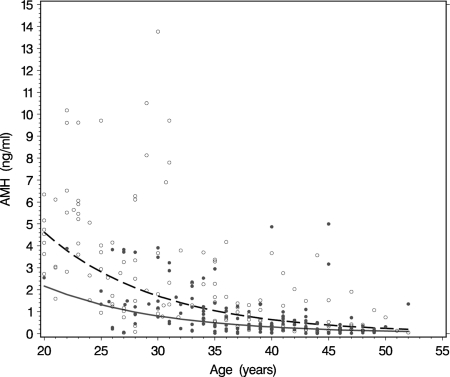
Figure 2.
Scatterplot of AMH levels by age for premutation carriers (closed circles) and non-carriers (open circles). The best fitting curves (solid line for premutation carriers and dashed line for non-carriers) were constructed by a multilevel mixed linear model, accounting for the clustering of observations within subjects and clustering of subjects within families, on the logarithmic transformed AMH values. For this model we used as independent variables age and premutation status.

