
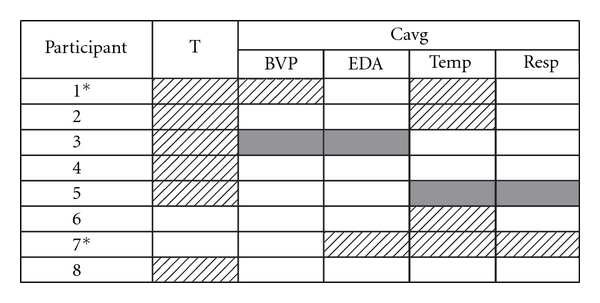
Table 2.
Results of the regression analyses of the ANS data.
|
Highlighted cells represent significant differences between AA and BB conditions (P < .05). Solid cells indicate a reduction in physiological responding while hatched cells represent an increase relative to baseline levels. *Denotes partial data set (i.e., AAB).