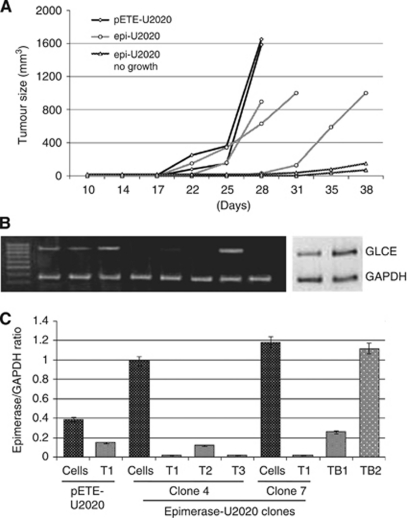
Figure 4.
Effects of GLCE on tumour formation in SCID mice. (A) Tumour formation rate curve. Epi-U2020 (clones 4, 7 and 8) was used for inoculation. Three independent experiments were performed. (B and C) GLCE expression in mouse xenograft tumours. (B) Representative gel showing GLCE amplified by multiplex RT–PCR. (C) Intensity of the amplified epimerase DNA fragments normalised to that of GAPDH. Bars represent the mean±s.d. from triplicate experiments (OriginPro 8.1). The lane order on the gel corresponds to the bars on the histogram. Cells=epi-U2020 or pETE-U2020 cells; T=epi-U2020 or pETE-U2020 tumours; TB=slow-growing xenografts.

