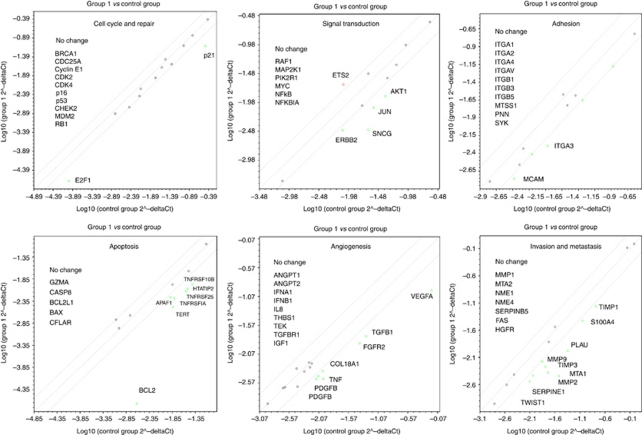
Figure 5.
Cancer PathFinder RT2 Profiler PCR Array analysis of epimerase-expressing U2020 cells. The relative expression levels for each gene in epimerase-expressing U2020 cells (Group 1) are plotted against the same gene from the control pETE-U2020 cells (Control Group). The middle line shows the similar expression in both groups with two-fold change boundaries. Genes upregulated greater than two-fold in epi-U2020 cells lie above the middle line and the downregulated genes lie below the line.

