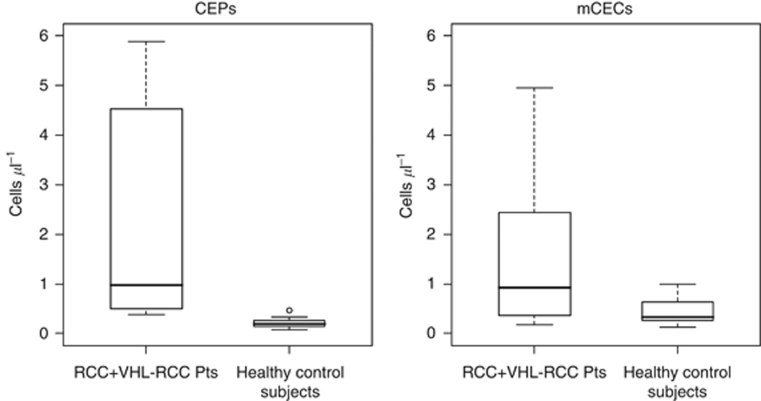
Figure 2.
Box plots demonstrate that RCC patients have more CEPs and mCECs than healthy control subjects have. Data (medians and ranges) are from 10 patients with RCC (4 with sporadic non-metastatic RCC and 6 with VHL–RCC) and 17 healthy control subjects. The thick horizontal line within each box is the median value; the upper and lower boundaries of the boxes are the 75th and 25th percentiles. The bars above and below the boxes are placed at the observed values closest to the 75th percentile plus 1.5 times the interquartile range (75th percentile minus 25th percentile) and closest to the 25th percentile minus 1.5 times the interquartile range; observations outside those limits are plotted separately and represented with a small circle. Observations more extreme than 6 were excluded from these figures.

