Figure 1.
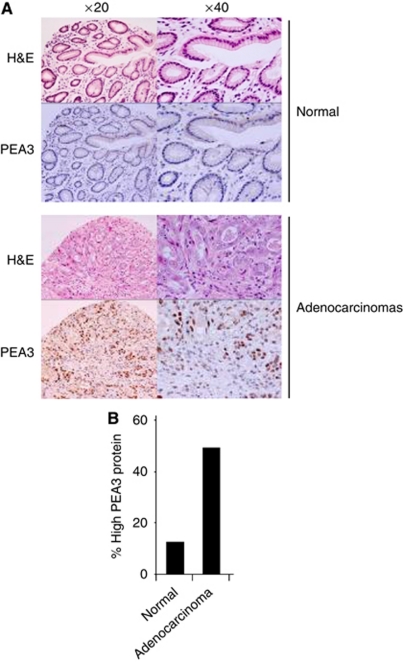
PEA3 protein expression in gastric adenocarcinomas. (A) Examples of typical TMA staining (brown stain) for PEA3 protein in normal gastric epithelium and adenocarcinoma (top panels H&E, bottom panels PEA3 staining) at × 20 and × 40 magnification. (B) Summary of TMA data for moderate–high PEA3 protein expression (scored as intensity 3 or 4) in patient samples from normal and adenocarcinoma tissue classes.

