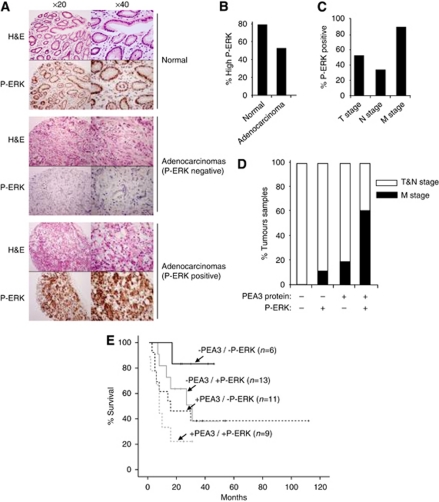
Figure 3.
Correlative expression of PEA3 with high levels of ERK MAPK signalling in gastric adenocarcinoma specimens. (A) Examples of typical TMA staining (brown stain) for phosphorylated active ERK (P-ERK) levels in normal gastric epithelium, negative adenocarcinoma and positive adenocarcinoma (top panels H&E, bottom panels P-ERK staining) at × 20 and × 40 magnification. (B) Summary of TMA data for moderate–high P-ERK signalling in patient samples from normal and adenocarcinoma tissue classes. Positive ERK MAP kinase signalling is defined as more than 5% tumour cells staining positive for P-ERK at intensity 3–4 at × 20 magnification. (C) Histograms correlating the percentage of patients with TNM stage and phospho-ERK (P-ERK) levels (as defined in B). (D) Patients with a combination of higher than basal P-ERK levels and above basal PEA3 protein expression are correlated with metastatic M-stage disease. Positive P-ERK signals and PEA3 protein presence are defined as in (B). Data are presented as the percentage of patients containing the indicated combinations of P-ERK and PEA3 levels, which have T and N (white bars) or M-stage (black bars) tumours. (E) Patients with the indicated combinations of basal level (−), and above basal P-ERK levels and PEA3 protein expression (+) are correlated with % survival. The numbers of cases with each combination of markers are shown in brackets.

