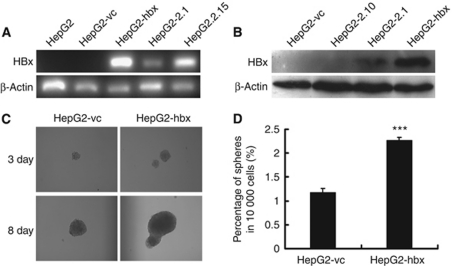
Figure 1.
Generation of HepG2 cell lines stably expressing the HBx gene. (A) RT–PCR and (B) western blot analysis confirmed the mRNA and protein expression, respectively, of the HBx gene in the HepG2-hbx and HepG2-2.1 cell lines. HepG2 cells stably transfected with vector alone (HepG2-vc) were used as a negative control. (C, D) HepG2-hbx cells produced significantly larger and more numerous spheres in an anchorage-independent sphere formation assay than did HepG2-vc under serum-free conditions. Representative graphs are presented. The data are presented as mean numbers of spheres ±s.e. (***P<0.001; Student's t-test, n=3).

