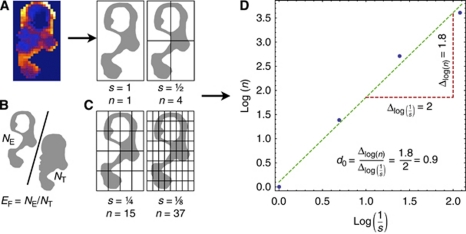
Figure 1.
Derivation of a thresholded parameter map to enable calculation of enhancing fraction (EF) and box dimension (d0). (A) Ktrans map across a single slice within a CRC liver metastasis shows marked spatial heterogeneity. (B) A criterion is applied to the contrast agent concentration time series to identify enhancing voxels (NE) and the resultant map is shown. EF is calculated as the ratio of NE to the number of tumour voxels (NT). (C) A box surrounding the object defined by the enhancing voxels is successively divided, defining a range of scales (s) at which the number of boxes containing a part of the object is counted (n). (D) d0 is the slope of the line of best fit through the points (log n, log 1/s) and quantifies the space filling properties of the parameter map.

