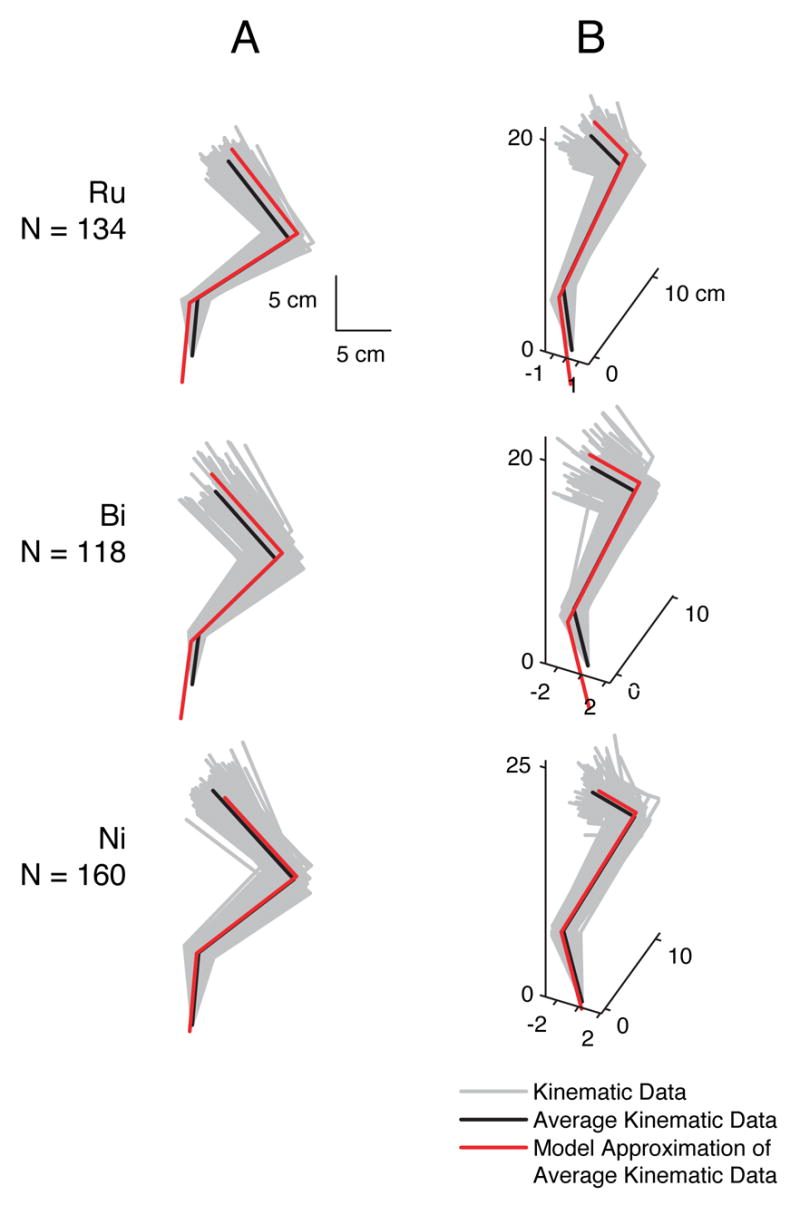
Fig. 3.

Model postures were based on kinematic data of three cats. Column A: sagittal view. Column B: posterior-lateral view. Light gray traces are kinematic data from each trial (Ru: N=134, Bi: N=118, Ni: N=160), used in the FFS computation. Black traces are the average kinematic data for each cat. Red traces illustrate the best fit of the model to the average segment angles in the frontal and sagittal planes for each cat (see Section 2.4).
