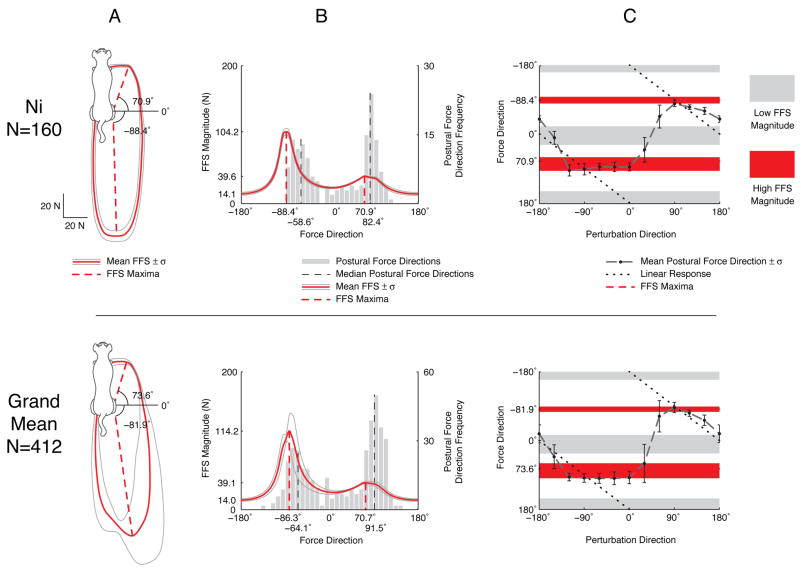
Fig. 4.
FFSs and active postural force directions for cat Ni (top row), and the grand mean across all cats (bottom row). Angle conventions are defined in Fig. 1. A: Dorsal plane FFS mean ±SD (red thick and thin lines, respectively). FFS maxima (dashed lines) are directed either posteriorly or anteriorly with small lateral components. FFS minima are in the medio-lateral directions. The mean FFS of the individual animal and the grand mean are bimodal, similar to the two-vector force constraint strategy. B: FFS magnitude from A (solid red line, left hand scale), plotted against force direction and histogram of active postural response forces (gray bars, right hand scale). Postural force directions are bimodal with peaks (dashed gray lines) clustered near the maxima of the FFS (dashed red lines). No active forces were directed medially, near the FFS minima. C: Active postural forces generated by the hindlimb (black circles) are not directly opposite to the perturbation direction (dotted black line). Instead, forces tend towards directions of high feasible force magnitude (red shaded area) and away from regions of low feasible force magnitude (gray shaded area). The FFS maxima therefore act as attractors of force direction that have stronger influence on lateral perturbation directions (−90° to 90°) than medial perturbations (≤ −90° or ≥ 90°).

