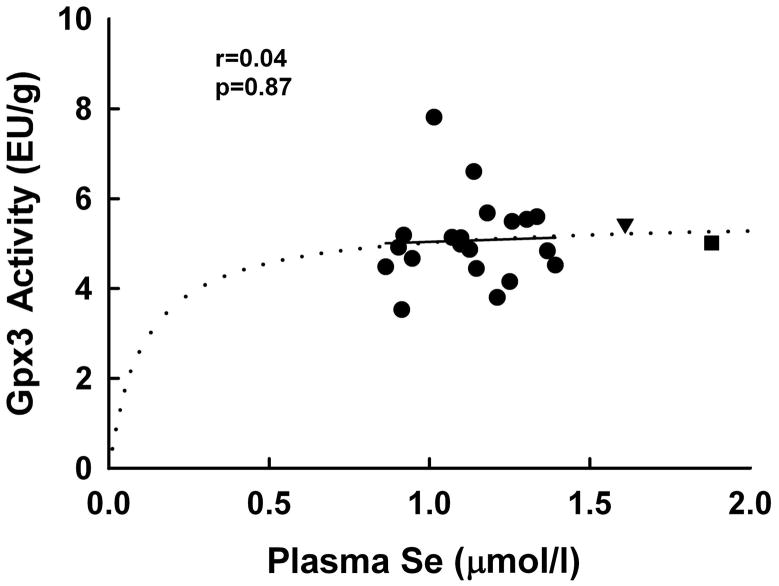
Fig. 3.
Correlation between plasma Gpx3 enzyme activity and plasma Se concentration (●). Plasma Gpx3 values are means for each subject for values determined at weeks 2, 8, 17 and 23; plasma Se values are the means for each subject (n = 20) of values determined at weeks 2 and 23. Shown is the linear regression line (–), the correlation coefficient and P-value for significance. Also plotted for reference are values from two US volunteers (male: ▼, female: ■), and a simple hyperbolic fit for the Reading data (…).

