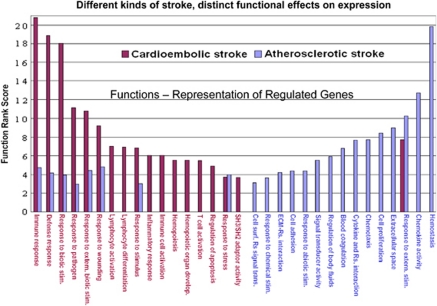
Figure 10.
Functional comparisons of cardioembolic stroke-specific genes versus atherosclerotic stroke-specific genes. The function rank score (Y axis) is a log-transformed P value. The higher the score, the more significant is the functional pathway (shown on the Y axis). The functions are on the X axis. Cardioembolic functions are in red and large-vessel atherosclerotic functions are in blue. This figure is adapted from Xu et al (2008).

