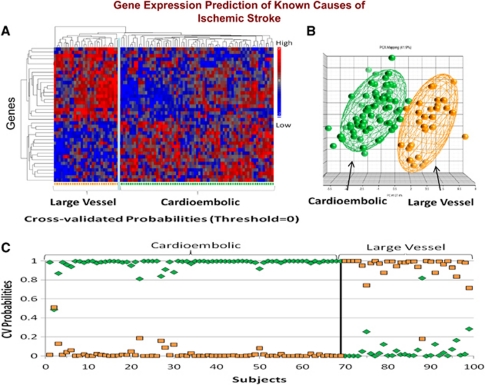
Figure 5.
(A) Hierarchical cluster plot of the 40 genes that were significantly different between cardioembolic stroke and large-vessel stroke. Genes are shown on the Y axis and subjects are shown on the X axis. Red indicates a high level of gene expression and blue indicates a low level of gene expression. Subjects cluster by diagnosis. (B) Principal components analysis of the 40 genes that differentiated cardioembolic stroke from large-vessel stroke. Each sphere represents a single subject. The ellipsoid surrounding the spheres represents 2 s.d. from the group mean. (C) Leave-one-out crossvalidation prediction analysis of the 40 genes found to differentiate cardioembolic stroke from large-vessel stroke. The probability of the predicted diagnosis is shown on the Y axis. The actual diagnosis is shown on the X axis, where patients with known cardioembolic stroke are shown on the left (top bracket), and patients with known large-vessel stroke are shown on the right (top bracket). The probability of a predicted diagnosis of cardioembolic stroke is indicated with green diamonds, and the probability of a predicted diagnosis of large-vessel stroke is indicated with orange squares. Subjects with known cardioembolic stroke were predicted to have cardioembolic stroke for 69 out of 69 samples (100% correct prediction). Subjects with known large-vessel stroke were predicted to have large-vessel stroke for 29 out of 30 samples (96.7% correct prediction). A sample is considered misclassified if the predicted class does not match the known class with a probability >0.5. This figure is adapted from Jickling et al (2010).

