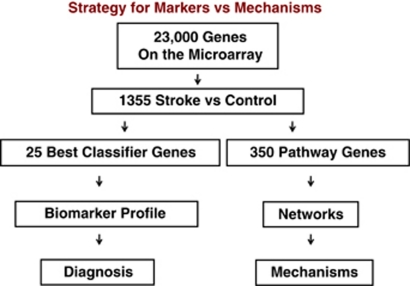
Figure 7.
Strategy for deriving gene lists to for prediction (biomarker profile and diagnosis) versus lists to study pathways, networks and mechanisms. Stroke versus controls produces a large gene list using loose statistical criteria. Prediction algorithms (e.g., linear discriminant analysis, support vector machine and others) are used to derive the best classifier/prediction genes, which are then applied to a second test set for prediction. An intermediate statistical cutoff is used to generate a list of hundreds of genes that can then be used for pathway, gene ontology, and other analyses to assess pathways, networks, and mechanisms.

