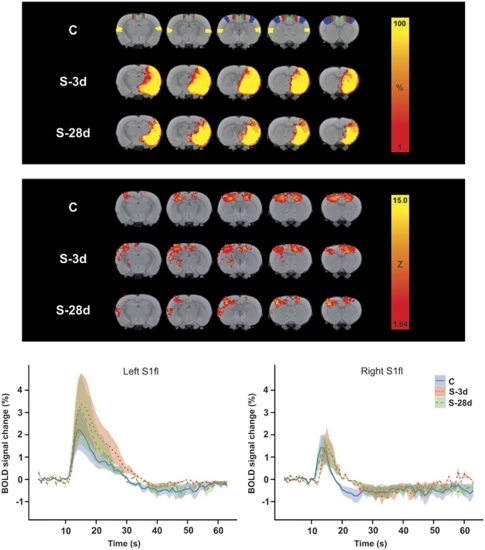
Figure 1.
(Top panel) Color-coded local incidence of T2-based lesion (percent of group size) in control rats (C; n=6) and rats at 3(S-3d; n=6) or 28 days after stroke (S-28d; n=4), overlaid on consecutive coronal rat brain slices from a T2-weighted template. The bilateral regions-of-interest (ROIs) S2 (secondary somatosensory cortex) (yellow), S1fl (forelimb region of the primary somatosensory cortex) (blue), M1 (primary cortex) (red), and M2 (secondary motor cortex) (green) are depicted on the template of group C. (Middle panel) Mean maps of significant blood oxygenation level-dependent (BOLD) activation in response to direct intracortical stimulation (DICS) of the left (contralesional) M1 in rats from groups C, S-3d, and S-28d. Color-coded maps display Z values, overlaid on consecutive coronal rat brain slices from a T2-weighted template. (Bottom panel) Averaged BOLD signal time courses (lines)±s.e.m. (shadings) in left (contralesional) (left graph) and right (ipsilesional) (right graph) S1fl in response to DICS of left (contralesional) M1, for groups C (solid blue lines), S-3d (dotted red lines), and S-28d (dashed green lines).

