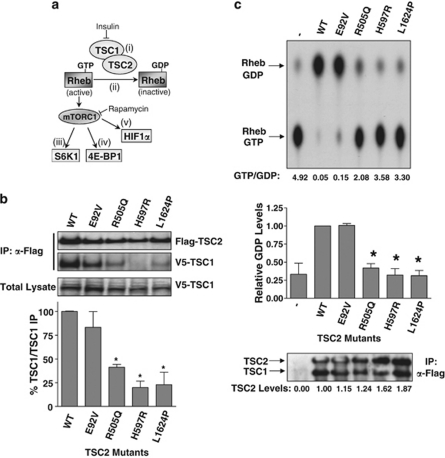
Figure 2.
(a) A diagram of the cell signalling network analysed, which includes (i) the interaction of TSC2 with TSC1, (ii) an in vitro RhebGAP activity assay, and assays for (iii) S6K1, (iv) 4E-BP1 and (v) HIF-1α to measure downstream signalling through mTORC1. (b) Formation of the TSC1/TSC2 heterodimer was analysed by immunoprecipitation of Flag-TSC2 followed by western blotting for V5-TSC1. Immunoprecipitated Flag and total V5 blots are shown as controls. The percentage of TSC1 bound to TSC2 is shown relative to the wild-type binding level. All densitometry data were corrected for total TSC1 and TSC2 levels and are shown as the mean±SD of combined independent experiments. The interaction level of each mutant was compared with wild type using a t-test; *indicates P<0.01 (lower panel). (c) In vitro RhebGAP activity was assessed for each TSC2 mutant, and the levels of GTP and GDP following the assay were analysed by thin layer chromatography. The ratio of GTP/GDP for the representative experiment shown is below the autoradiograph. Combined densitometry data (mean±SD) for the conversion to GDP are shown in the graph below the blot, with those mutants showing a significant difference to wild-type indicated (*indicates P<0.01). Total TSC1 and TSC2 protein levels are shown as a loading control.

