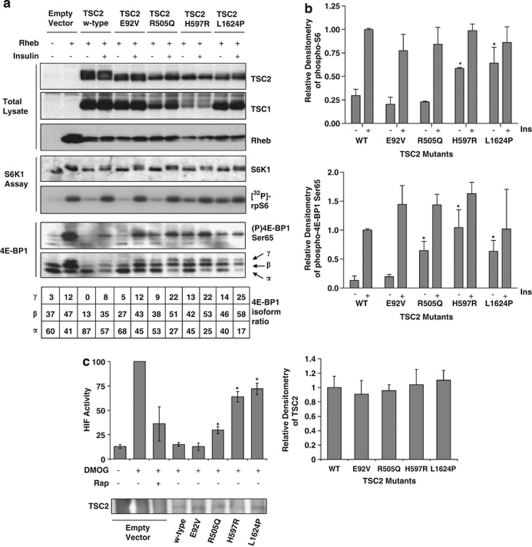
Figure 3.
(a) Activation of mTORC1 following TSC2 mutant overexpression was assessed by analysing downstream mTORC1 targets. An S6K1 assay was performed using a rpS6 peptide as substrate. Incorporation of [32P]-radiolabel into rpS6 was assessed by autoradiography, and S6K1 immunoprecipitates were probed for total S6K1. Blots shown are representative of three independent experiments (middle panels). HEK293 cells were transiently transfected with Flag-TSC1, Flag-TSC2 (wild type or mutant), Flag-Rheb and Myc-4E-BP1 and treated with or without 100 n insulin for 30 min as shown in the figure. Total cell lysates were probed for phospho-Ser65 4E-BP1 and total 4E-BP1. Each isoform of 4E-BP1 in the total blot was assessed by densitometry and the percentage of each isoform is indicated under the figure. Blots shown are representative of three independent experiments (lower panel). Levels of TSC1, TSC2 and Rheb are shown as controls (upper panels). (b) Densitometry data for the levels of phospho-rpS6 (upper graph) and phospho-4E-BP1 at Ser65 (lower graph) are shown. Bars represent the mean±SEM of the combined data. The level of repression in unstimulated cells was compared with the control samples using Student's t-test, *P<0.05. (c) The ability of the mutant TSC2 proteins to downregulate HIF-1α activity was assessed using a HIF-1α reporter assay. The graph shows data from three independent experiments, each performed in triplicate, with error bars representing standard deviation. Values which are statistically different to wild-type are indicated, where *P<0.01. Total TSC2 protein levels are shown in the western blot, and the densitometry for the total TSC2 protein levels across the three experiments is shown in the graph on the right. Levels were not significantly different.

