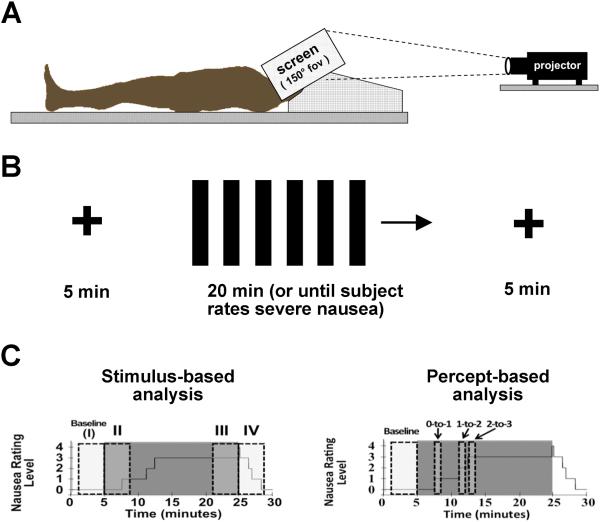
Figure 1.
Experimental procedure and analysis approach. (A) Subjects lay supine while a nauseogenic visual stimulation (horizontally translating stripes) was projected onto a full field-of-view screen from behind. (B) The visual stimulus was comprised by cross-hair fixation for 5 minutes before and after linear vection stimulus, which lasted up to 20minutes, or until the subjected rated a nausea level “4” for “severe” nausea. (C) Autonomic data were analyzed with both a stimulus-based (left) and percept-based (right) approach, where data averaged over discrete windows were compared to data collected during cross-hair fixation at baseline.

