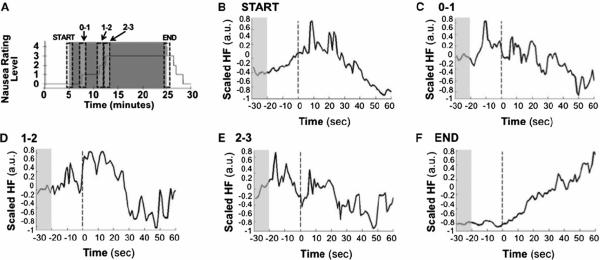
Figure 4.
Average across subjects of normalized point process HF HRV. (A) Schematic representation of the 90-second window placements. (B–F) HF HRV timeseries within windows of interest averaged across subjects demonstrate robust gradual decrease following stimulus initiation and gradual increase following stimulus cessation. Phasic bursts of HF power are noted prior to change in nausea perception.

