
Figure 1.
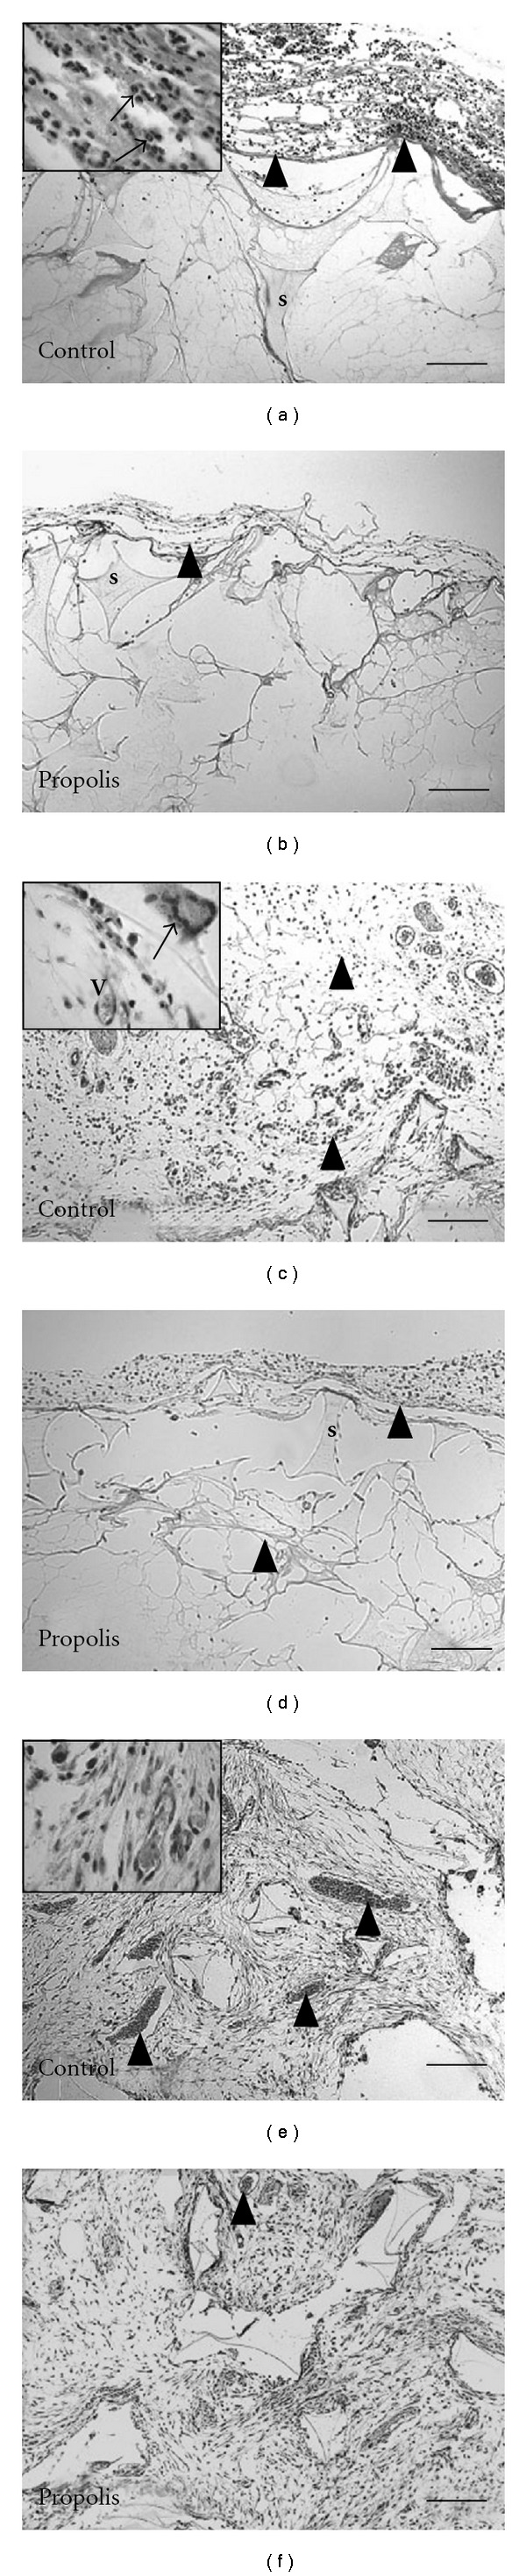
Representative histological sections of sponge implants (5 μm stained with HE) from control (a, c, and e) and propolis-treated groups (b, d, and f) at 4, 7 and 14 days, respectively. The fibrovascular stroma that occupies the pores of the sponge matrix (s) is progressively filled with inflammatory cells, blood vessels (v), fibroblasts and collagen fibers. The granulation tissue in control implants is denser and more vascularized compared with the propolis-treated group. Arrowheads indicate the cell infiltration in the implant (a, b). Inset (1000x): A—arrows show inflammatory cells infiltration; C—arrow shows giant cell and (v) shows blood vessel; E—arrow heads and (v) in the inset (1000x) show blood vessel; F—arrow head shows blood vessel. Bar: 16 μm.