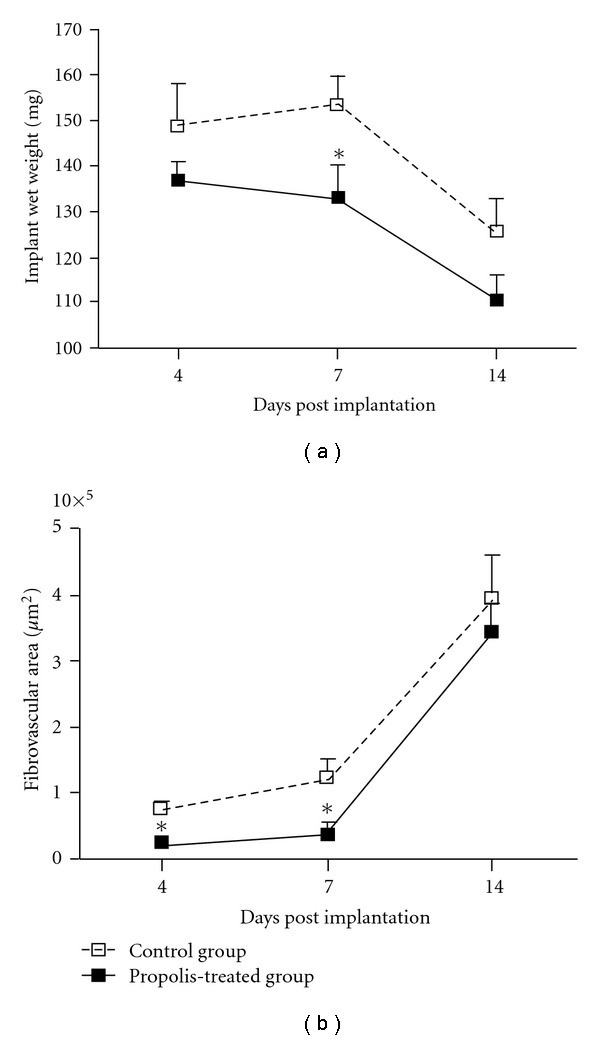
Figure 2.

Wet weight (a) and fibrovascular area (b) of the implants from control and propolis-treated groups are shown in this Figure. In the treated group the wet weight was significantly lower than in the control group at day 7. The fibrovascular area in the propolis-treated group was significantly reduced compared with the control group at days 4 and 7. Data are represented as mean ± SEM of groups of 8–10 animals. *P < .05 compared with control group.
