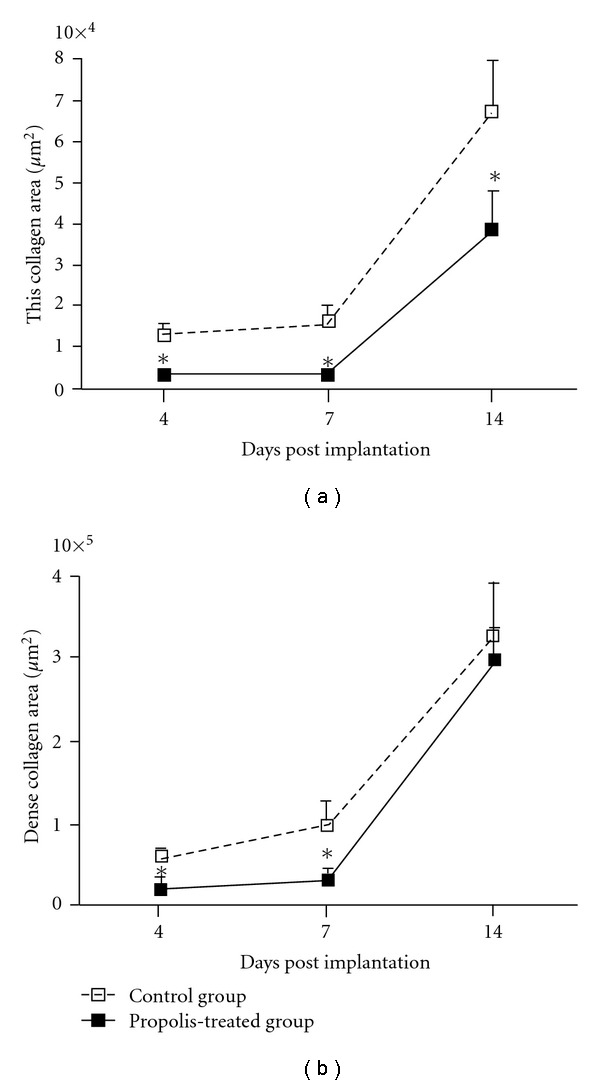
Figure 4.

Morphometric analysis of the collagen deposition showing that the deposition of thin (a) and dense (b) collagen in the implants was significantly lower in the treated group at 4 and 7 days post-implantation. Data are represented as mean ± SEM of groups of 8–10 animals. *P < .05 compared with control group.
