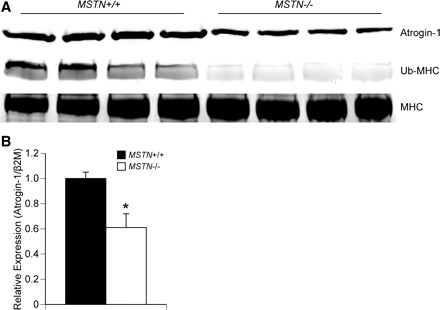
Fig. 4.

A: immunoblot showing that, compared with MSTN+/+ mice, EDL muscles from MSTN−/− mice have a decrease in atrogin-1 and ubiquitinated myosin heavy chain (Ub-MHC). Total myosin heavy chain (MHC) is shown as a loading control. N = 4 mice from each genotype. B: gene expression data showing that, compared with MSTN+/+ mice, EDL muscles from MSTN−/− mice have a decrease in atrogin-1 expression. N = 4 mice from each genotype. Values are means ± SE. *Significantly different from MSTN+/+ (P < 0.05).
