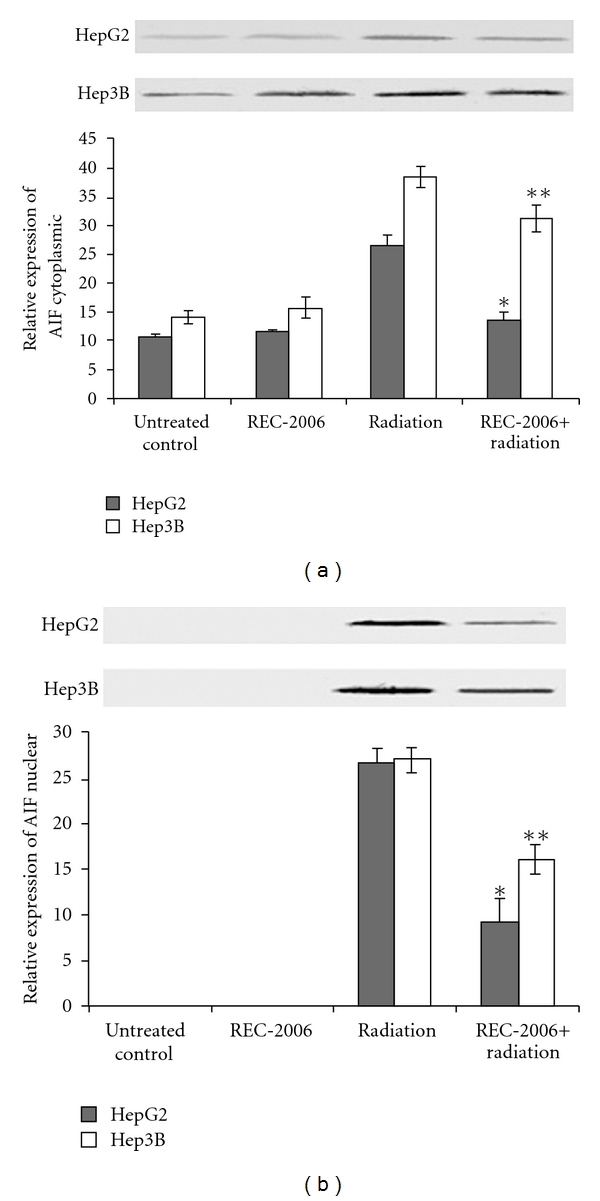
Figure 3.

Effect of optimal concentration of drug (REC-2006), that is, 10−5 μg mL−1 given 2 h prior to irradiation (LD80 of respective cell lines) on expression of (a) cytoplasmic AIF; (b) nuclear AIF in HepG2 and Hep3B cell lines. Single asterisk indicates significant radiomodulatory activity (increase/decrease in expression) in HepG2 cell lines, whereas double asterisks indicate the corresponding effect in Hep3B cell lines with respect to radiation (LD80) controls.
