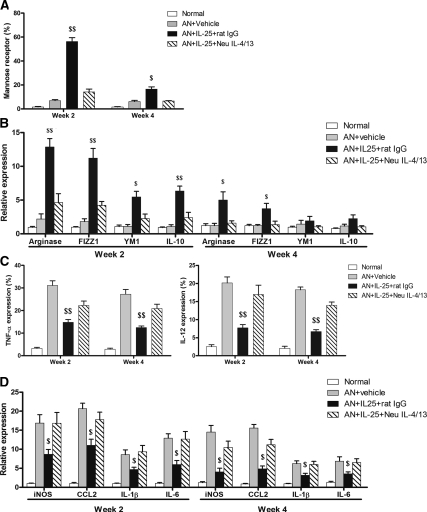
Figure 6.
IL-25 induced M2 macrophages and suppressed endogenous renal macrophages in an IL-4/13–dependent manner. The percentage of endogenous renal macrophages expressing MR, TNFα, and IL-12 was measured by flow cytometry (A and C) and the mRNA expression of arginase, FIZZ1, YM1, IL-10, iNOS, CCL2, IL-1β, and IL-6 was quantified by real-time PCR (B and D). The values represent the mean ± SEM of evaluations from each group (n = 8 per group). $P < 0.05 and $$P < 0.01 versus the other three groups.

