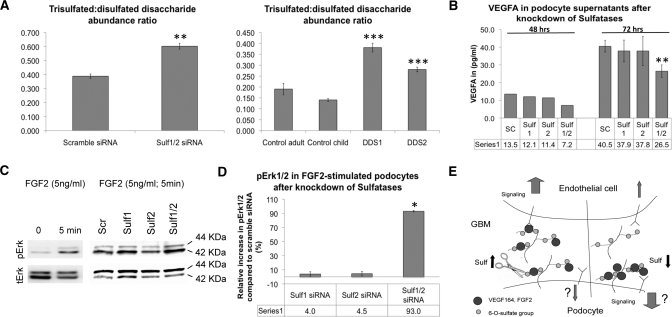
Figure 6.
Knockdown of Sulf1 and Sulf2 in vitro modulates VEGFA and FGF2 signaling. (A) Relative abundance of trisulfated disaccharides within HS chains represented by a ratio between trisulfated and disulfated disaccharides in Sulf siRNA knockdown podocytes (left panel) and primary podocytes from DDS patients (right panel), assayed by SEC LC/MS after heparin lyase depolymerization of HS. Samples were analyzed in triplicate. Error bars: ±SEM. **P < 0.01; ***P < 0.001. (B) Secreted VEGFA measured by ELISA in cell supernatants of differentiated podocytes after using a scramble siRNA (Sc) as a control or after knockdown of either Sulf1 or Sulf2 or both simultaneously. VEGFA concentrations were normalized to the total protein in the seeded cells. Error bars: ±SEM from three independent experiments. **P < 0.01. (C, D) Western blot and quantification demonstrating percentage increase in phospho-Erk1/2 (normalized to total Erk1/2), after knockdown of Sulf1 or Sulf2 or both and induction with 5 ng/ml FGF2 for 5 minutes. Columns represent the differences between a scramble siRNA and the Sulf siRNAs. Error bars for FGF2: ±SEM from two independent experiments. *P < 0.05. (E) A model of Sulf-regulated VEGF165 and FGF2 signaling. Left side, physiologic condition; right side, decreased Sulf levels.

