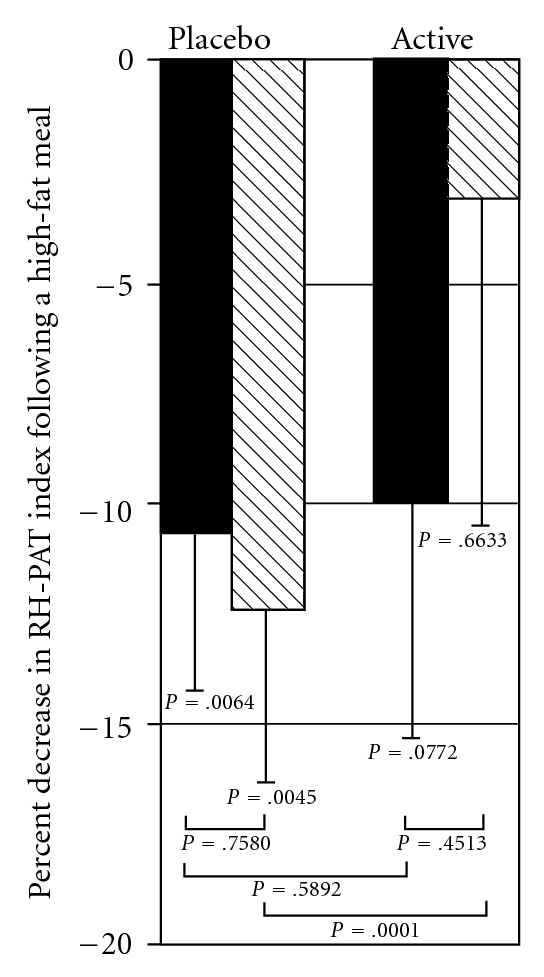
Figure 2.

Percent changes in RH-PAT index from a fasting state obtained 3 h after a high-fat meal, at the beginning and end of each study phase. Solid bars, Baseline (before study supplement); Hatched bars, After 4 weeks of study supplement; Values shown as Mean & Standard error.
