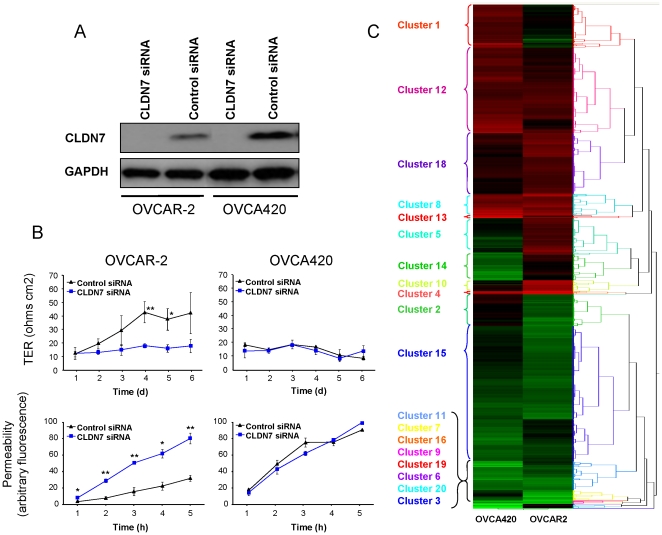
Figure 3. CLDN7 knockdown and its effects on gene expression.
A. Immunoblot analysis of OVCAR-2 and OVCA420 cells following CLDN7 knockdown for 72 hrs. B. Effects of CLDN7 knockdown on TJ and permeability. Transepithelial resistance (TER) was measured at multiple time-points following CLDN7 knockdown. Permeability was measured by evaluating the ability of fluorescein-isothiocyanate-dextran (40 kDa) to cross the monolayer. Fluorescence measurements reflect monolayer permeability and the results mirror the TER measurements. Experiments were performed in triplicate and the results are shown as average +/− S.E.M. An asterisk (*) indicates a p-value<0.05, and a double asterisk (**), a p-value<0.01. C. Hierarchical clustering analysis of gene expression following CLDN7 knockdown in both cell lines. The green color represents down-regulation, while red represents up-regulation. A total of 20 clusters of genes exhibiting distinct patterns were identified.

