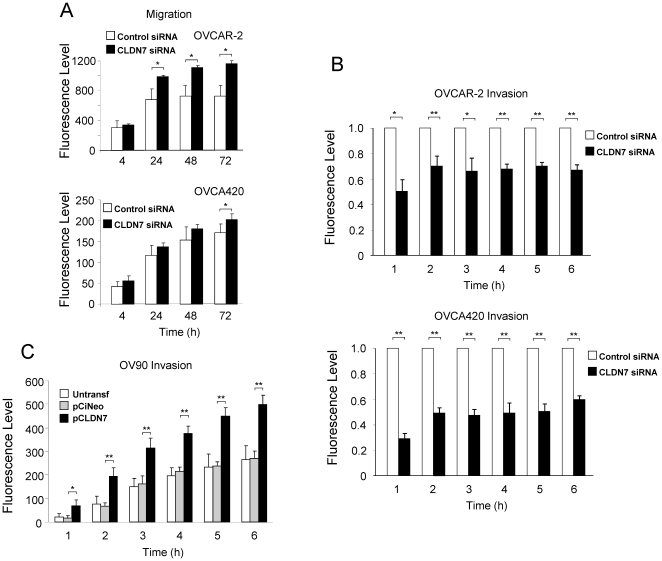
Figure 7. Effects of CLDN7 on the migration and invasion of ovarian cancer cells.
A. Migration assays in OVCAR-2 and OVCA420 cells. The migration of cells with CLDN7 knocked down (dark bars) or control cells (white bars) was measured at different time point after the beginning of the assay. B. Boyden chamber invasion assay of OVCAR-2 and OVCA420 cells with and without CLDN7 knockdown. The number of invading cells was measured every hour for 6 hours. C. Invasion assays in a model of CLDN7 overexpression. Two stable lines, OV90-CLDN7 and OV90-CiNeo, as well as untransfected parental OV90 cells were used to test changes in invasion following CLDN7 overexpression. For all the results shown in this figure, the experiments were performed in triplicate and the results are shown as mean +/− S.E.M. An asterisk (*) indicated a p-value<0.05, and a double asterisk (**), a p-value<0.01.

