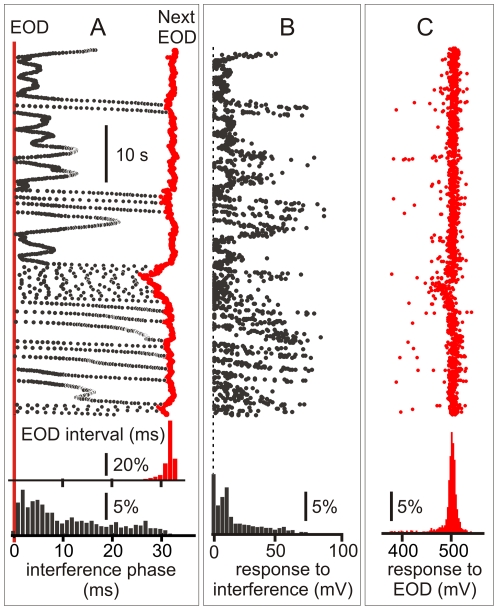
Figure 9. Field potential responses to self- and allo-generated signals in freely discharging fish.
A) The raster plots shows the time course of phase of interfering stimulus (black) and the next EOD interval (red) in a freely discharging fish chronically implanted at the magnocellularis nucleus. Histograms at the bottom in show the relative frequency of interference after the EOD (black bars, ordinate: 100× number of allo-generated stimuli per bin divided the total number of EODs) and the first order interval histogram (red). B) Raster plot representing the amplitude (abscissa) of the field potentials evoked by the EOD at the magnocellularis nucleus (the time course of the experiment in register with A) and the amplitude histogram. C) Raster plot representing the amplitude (abscissa) of the field potentials evoked by the EOD at the magnocellularis nucleus (the time course of the experiment in register with A and B) and the amplitude histogram. Note that amplitude histogram in B shows a relatively larger dispersion than in C.

