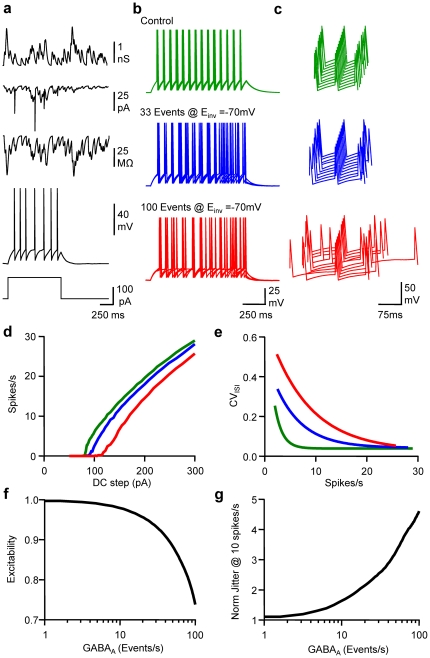
Figure 3. Modelling frequency-dependent tuning of neuronal excitability and spike timing.
a, From upper to lower, an example of GGABA-A pattern of 33 events/s, IGABA-A, Rin, Vm and a DC step (1 s, 120 pA) when running the LIF model. b, Superimposed (5) Vm fluctuations in response to a DC step (1 s, 160 pA) in control (green), in the presence of 33 (blue) or 100 (red) randomly occurring GABAA events/s with EGABA set at −70 mV. Same cell and colour code for c,d and e. c, Waterfall view of Vm when the 5th spike was set as time reference. d, Mean Firing rate vs DC step. e, CVISI vs firing rate. f, Normalised changes in excitability observed when LIF received 1 to 100 randomly occurring GABAA events/s. g, Normalised changes in spike jitter for a firing rate of 10 spikes/s.

