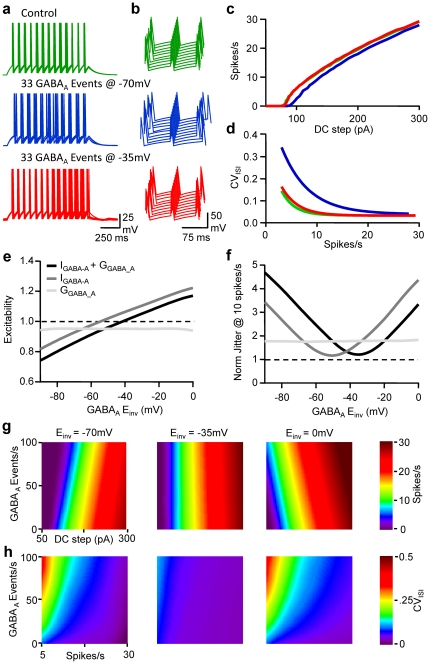
Figure 7. Frequency and reversal potential-dependent tuning of pyramidal cell excitability and discharge fidelity.
a, Superimposed (5) Vm fluctuations of the LIF model in response to a DC step (1 s, 160 pA) in control conditions (green), when the LIF model received 33 randomly occurring GABAA events/s at EGABA = −70 mV (blue) or −35 mV (red). Same colour code for b, c and d. b, Waterfall view of Vm when the 5th spike was set as the time reference. c, Mean firing rate vs DC step. d, CVISI vs firing rate. e, Normalised changes in excitability observed when LIF model received 33 randomly occurring GABAA events/s at various EGABA in control conditions (black), when GABA activity induced only transient changes in IGABA-A (gray) or when GABA activity induced only transient changes in Rin (light gray). f, Normalised changes in spike jitter observed for a rate of 10 spikes/s. Same conditions as in e. g, From left to right firing rate displayed on a pseudocolor scale vs DC step and EGABA when the LIF model received 33 randomly occurring GABAA events/s in control conditions (left), when GABAA activity induced only transient changes in IGABA-A (middle) or when GABA activity induced only transient changes in Rin (right). h, CVISI displayed on a pseudocolor scale vs firing rate and EGABA. Same conditions as in g.

